


The Forces of Supply and Demand
Abstract: The primitive forces of capitalism rule markets like the laws of gravity. Buyers and sellers provoke a battle to find a happy medium agreement in every financial market. As prices dance around on charts, traders are often looking for reasons to explain price movements however, the underlying source of price movement boils down to the relationship between supply and demand. Generally, positive news means increased demand and lessened supply – equating to higher prices. Negative news usually spells lower demand and increased supply.
What is supply and demand?
Supply and demand is the relationship between buyers and sellers that is used as a measure for price determination in financial markets. The forces of supply and demand interact to affect an equilibrium price between buyers and sellers whereby the quantity of demand equals the quantity of supply.
What are the laws of supply and demand?
‘Supply’ is purely the amount available, while ‘demand’ is the amount that is desired. The graphs below indicate the visual aspect of supply, demand and equilibrium respectively.
Supply: the relationship between price and quantity

Demand: the relationship between price and quantity

Equilibrium: the most efficient price at which quantity demanded equals the quantity supplied:

Supply and Demand Zones
Supply and demand zones allow traders to gain a perception into the current financial markets, and these are illustrated in the charts below.
It is noticeable that supply and demand zones cover a broader area as opposed to support and resistance levels. These broader zones provide more reliable price regions than a single line/level which can be a better gauge for future price movements.
The supply zone below shows an area clustered by sellers because price tends to ‘bounce’ lower off this demarcated zone. This quick price movement off these zones characterizes the features of supply and demand zones. The demand zone exhibits the same attributes as the supply zone in the opposing direction – demand zone mimics a broad area of support.


Supply and Demand in the Forex Market
Supply and demand within a vegetable market is not all too dissimilar from that which takes place every day in the forex market. In some cases, these forces are moving at such high velocity that new traders can have difficulty understanding the granularity of the details.
The forex market is the largest financial market in the world because of the heavy demand behind the traded assets. Currencies are the basis for the worlds economy and whenever one economy wants to trade with another economy (provided different currencies are used) an exchange will be required.
How does supply and demand work?
In a nutshell, supply and demand works by analysing the quantity of buyers and sellers within the forex market.
How do supply and demand influence market price?
Imagine that the South African Reserve Bank (SARB) enacts an interest rate change. An entire chain reaction will be set in motion due to the forces of supply and demand. When rates increase, forex rollover payments also increase.
This means that investors that are holding the trade open at the specified rollover time (varies from country to country) will receive a higher rate of interest than they would have previously - incentive has just increased.
All else being equal, more traders would want to buy; and fewer traders would want to sell as the opportunity cost of selling (the rollover payment) has just gotten more expensive.
Supply and demand forex – USD/ZAR daily chart:

As you can see, price aims to find a comfortable point and will increase until there are no more buyers willing to pay that price. At this point, sellers outnumber buyers, and price will respond by moving down.
After price has moved down far enough (red circle) traders will come back into the picture, remembering in the increased interest rate and the additional rollover payment that can be received from holding a long ZAR position, and this lower price presents a ‘perceived value.’
As additional buyers enter the picture, price will move up to reflect this increased demand.
This is the process of price attempting to find its fair value as it takes place on many different time frames in every market in the world.
Using supply and demand with support and resistance
The relationship between supply and demand along with support and resistance is important. This is because when price crosses key support and resistance levels, changes in supply and demand may occur within that currency pair.
Supply and demand trading explained
Often, a currency pair will climb to an area of resistance called a ‘selling zone’, where sellers perceive there to be great selling potential at a relatively overbought price. The reverse is also true for currency pairs that drop to relatively low levels, ‘demand zone’ where buyers perceive there to be great value to buy.
If you havent learned the basics of the supply and demand, or would like a refresher, read our guide on the forces of supply and demand.
Understanding Supply and Demand Zones
Supply and demand zones are observable areas on a forex chart where price has approached many times in the past. Unlike lines of support and resistance, these resemble zones more closely than precise lines.
Traders can customize charts to identify the demand and supply zones as shown on the USD/JPY below.

3 Tips for Using Supply and Demand to Trade Forex
Use longer time frames to identify supply and demand zones
By zooming out, traders are able to get a better view of areas where prices had bounced off previously. Be sure to use the appropriate charts when altering the between multiple time frames. Draw a rectangular shape to denote this zone. Demand and supply zones do not necessarily have to appear together-often currency pairs can reveal one or the other.
Identify strong moves off the potential demand/supply zone
Certain price levels offer value to either bullish or bearish traders. Once institutional traders and big banks see this value, they will look to capitalize on it. As a result, price action tends to accelerate relatively quickly until the value has diminished or has been fully realized. Witnessing multiple instances of this at the same price level increases the probability that it is an area of value and therefore, a supply or demand zone.

Use indicators for confirmation of support and demand zones
Traders can incorporate daily or weekly pivot points to identify or confirm supply or demand zones. At DailyFX, we have a dedicated page showing relevant support and resistance levels for all major markets. Traders should look for support and resistance levels to line up with demand and supply zones for higher probability trades.

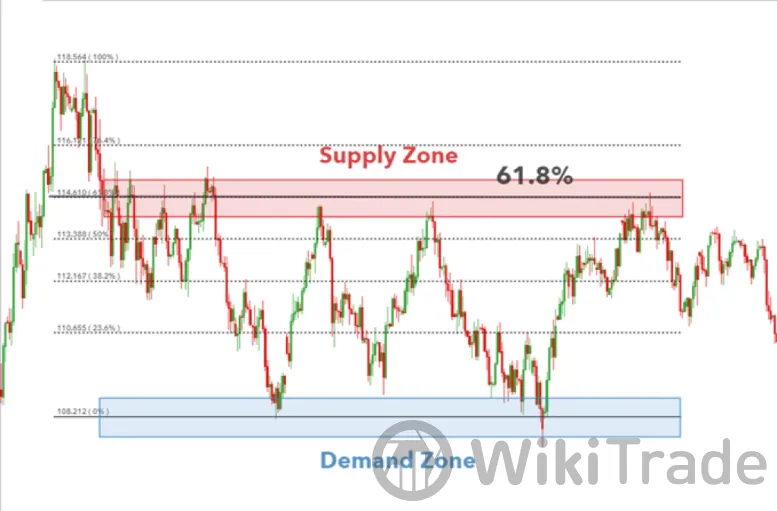
Furthermore, traders can use Fibonacci levels for greater accuracy on possible turning points at supply or demand zones. The 61.8% level is regarded as a significant level and corresponds with the supply zone in the chart below.
Supply and Demand Trading Strategies
Range trading strategy
Supply and demand zones can be used for range trading if the zones are well established. Traders can incorporate the use of a stochastic indicator or RSI to assist in identifying overbought and oversold conditions.
Since this is a non-directional trade in terms of the trend, both long and short entries can be spotted. After viewing oversold/overbought conditions on a longer-term chart, traders can zoom into a smaller time frame to spot an ideal entry.

Breakout strategy
The breakout strategy is another supply and demand trading strategy. Price cannot remain within a defined range forever and will eventually make directional movement. Traders look to gain favorable entry into the market, in the direction of the breakout, as it may be the start of a strong trend.
The USD/JPY chart shows a break out of the trading range but then retraces back towards the demand zone. Traders that place a short trade at the breakout are susceptible to being stopped out in this scenario. One way to mitigate this is to anticipate the retracement back to the demand zone before pacing the short trade.

Using supply and demand zones as risk management parameters
Demand and supply zones are very similar to support and resistance and therefore, these areas provide an indication as to where a trader can place stops and limits.
These areas allow traders to implement a positive risk-to-reward approach on all trades. Range traders that are selling at the supply zone can set stops above the supply zone and targets at the demand zone. Conservative traders can set the target above the demand zone or implement a number of other risk management techniques.
The USD/SGD chart below shows how stops and limits can be placed with reference to supply and demand zones:


Top News
 WikiTradeWikiTradeWikiTradeWikiTradeWikiTradeWikiTradeWikiTradeWikiTradeWikiTradeWikiTrade