


How to Trade with Long Wick Candles
Abstract: Long wick candles are recurrent within the forex market. This makes understanding the meaning behind these candles invaluable to any trader to comprehend the market dynamics during a specific period.
What are long wick candles?
Long wick candles are type of candlestick that have a long wick attached to the candle body. The candle body can be positive or negative, having the long wick appropriate for any type of candlestick.
The length of the candle wick specifies the high and low of price movement within a designated time period. Understanding and trading candlestick wicks can provide forex traders with key tradeable opportunities.

How to identify a long wick candle on forex charts
Locate long wicks above/below a candle that is disproportionately longer than that of the surrounding wicks.
Use price action to identify key price levels that may coincide with the long wick, signalling levels of support/resistance.
Use the long wicks and key levels to detect potential trade opportunities.

What does a long wick indicate in forex?
A long wick candle, like shooting stars, gravestone Doji‘s and hammers are part of a “family” of reversal candlesticks. Let’s explore an example:
NZD/JPY Long Wick Candles
The chart below shows NZD/JPY on a weekly time frame. Highlighted in blue illustrates long candle wicks prior to a reversal in price movement. In other words, if the longer wick is below the body of the candle, price tends to move up.
Conversely, if the longer wick is above the body of the candle, price tends to move down. These extended wicks (those that are longer relative to other wicks on the chart) provide valuable information for the trader.

A long wick that extends below a candle signifies that sellers were able to push the price down significantly. However, bulls were able to drive price back up showing buyers strength. Since bulls overpowered the selling pressure by bears, there exists the potential that their strength will carry forward leading to an upwards movement in price. The same principal would apply for long wicks appearing above the candle – in the opposite direction.
How can a trader use long wicks in their trading
The first step when utilizing long wicks is to identify the trend (as mentioned above). If the trend is down, seeing a candle (or several candles) with long wicks on the top points to a stronger potential for price to move down in the direction of the market.
Continuing with the downtrend example, if the pair retraces (moves against the trend) and stalls at a level of resistance or a Fibonacci level, traders will look for long wicks at the tops of the candles forming along that resistance line for two reasons:
Those long wicks indicate the potential for the pair to trade to the downside back in the direction of the trend.
The top of that extended wick provides a very prudent level for a trader to place their stop. The rationale for that stop placement being that buyers pushed price to the top of that wick but could not push it beyond that point. Hence, placing the stop just above that wick is a level that has a lower likelihood of getting hit.
There is often confusion amongst traders as to which time frame of chart this strategy can be applied to. For day traders, they may look at 5- or 10-min time frame charts. Swing traders on the other hand may look at other intraday charts like 2-hour or 4-hour charts.
Taking note of long wicks forming at levels of support or resistance, especially when they signal movement in the direction of the daily trend, can create a beneficial “edge” for the trader.
Advantages and Limitations of the Long Wick Candle
| Advantages | Limitations |
| Appears frequently in all financial markets | Cannot be traded using the long wick candle in isolation |
| Long wicks are easy to identify | Require supporting evidence to trade such as key price levels or indicators |
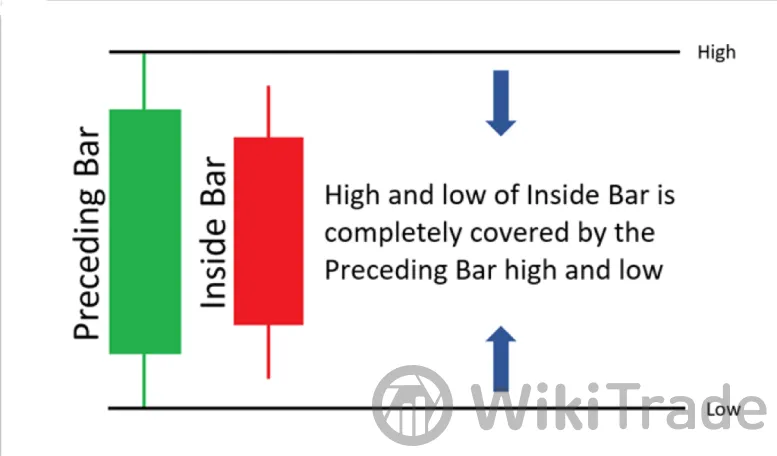
What is an inside bar?
The inside bar is a popular reversal/continuation candle formation that only requires two candles to present itself. This pattern is a direct play on short-term market sentiment looking to enter before the ‘big moves’ that may take place in the market. The inside bar shows a reluctance of prices to progress above/below the preceding candle high and low indicating market indecision.
How to identify an inside bar on forex charts
The following steps are used when identifying the inside bar pattern on forex charts:
Identify a preceding trend using price action/technical indicators
Locate inside bar pattern whereby the inside bar is engulfed fully by the preceding candle high and low

Trading with the inside bar candlestick pattern: Top Tips and Strategies
Some traders consider it a continuation pattern though a breakout in the opposite direction is possible too. After price has trended up (or down) for an extended period, the pause in price movement (represented by the inside bar) precedes a reversal of the trend. Therefore, the inside bar is looked at for a short-term trade (or swing trading) in the counter-trend direction with the goal of holding the trade for less than 10 bars.
However, there is another way to trade inside bars and this is rooted directly from what the candle pattern does NOT reveal. When traders see an inside bar pattern form, it is interpreted as the markets unwillingness to push price higher or lower. This can be for any number of reasons:
An extremely pertinent report is being issued soon, or
The market just made a stratospheric leap and traders are tepid about bidding price much higher or lower.
Whatever the reason, the motive is the same: seeking potential volatility in an effort to increase profitability. When there is a situation in which traders are unwilling to bid price higher or lower, it is seen as a potential situation for future increases in volatility. The inside bar candle pattern is NOT telling traders that the market is bidding price higher or lower but rather that the market is waiting before having the next big move in the asset. This means potential opportunities for traders.
Inside Bar breakout strategy
As mentioned previously, the inside bar represents a period of short-term consolidation with low volatility within a trending market. Traders then look to trade breakouts after a new high/low is formed.
In the EUR/GBP chart below, the preceding trend is seen by lower lows and lower highs. The breakout occurs below the low of the ‘preceding bar’ thus triggering a short entry into the market. Had this breakout occurred above the high of the ‘preceding bar’ then this can signal a long (buy) entry indicating a potential reversal in trend. Trading against the trend carries more risk which leads to greater caution taken by the trader.

Stop levels can be taken from the previous swing high/low (dependant on trend) as dictated by key price action levels. Using the stop as a benchmark, traders can use this stop distance to expand by a factor of two to realise the take profit (limit) level. This creates a 1:2 risk-reward ratio in line with responsible risk management. Fibonacci extensions may also be utilised as a limit forecast.
How reliable is the inside bar candle?
Inside bars signal continuation or reversals, which makes this trading pattern more complex. False breakouts can occur which lessens the reliability of the inside bar as an isolated pattern which is why traders prefer using the inside bar as part of an overall forex trading strategy. That is, the strategy is the foundation with the inside bar seen as more of a prompt.
| Advantages | Disadvantages |
| Occurs frequently within financial markets | Can signify reversal or continuation patterns |
| Opportunity for favourable risk-reward ratios | |
| Inside bars are easy to identify for novice traders |


Top News
 WikiTradeWikiTradeWikiTradeWikiTradeWikiTradeWikiTradeWikiTradeWikiTradeWikiTradeWikiTrade