


What is the Average True Range (ATR) indicator and how do you trade with it?
Abstract: The Average True Range (ATR) indicator measures market volatility, helping traders set stop losses and position sizes to manage risk effectively in various financial markets.
What is the Average True Range (ATR) indicator?
The Average True Range (ATR) is a powerful technical analysis tool developed by J. Welles Wilder Jr. to measure market volatility. Unlike other indicators that focus on price direction, the ATR solely measures the degree of price movement, having it an essential component of many traders' risk management strategies.
The ATR indicator adapts to different market conditions and timeframes, providing valuable insights into an asset's volatility. This adaptability makes it particularly useful for traders across various financial markets, including forex, stocks, indices, and commodities.

By understanding and utilising the ATR indicator, traders can make more informed decisions about position sizing and stop-loss placement, ultimately improving their overall risk management approach. The ATR moves up or down according to whether an asset's price movements are becoming more or less dramatic – with a higher ATR value representing greater volatility in the underlying market, and a lower ATR representing the opposite.
How to calculate the Average True Range (ATR)
The calculation of the Average True Range involves three main steps. While modern trading platforms usually perform these calculations automatically, understanding the process can help traders interpret the indicator more effectively.
Step 1: Calculate the True Range (TR)
The True Range for a given period is the greatest of these three values:
Current high minus the current low
Absolute value of the current high minus the previous close
Absolute value of the previous close minus the current low
Step 2: Collect TR values
Typically, traders use a 14-period ATR, meaning they collect 14 TR values. However, this period can be adjusted based on individual preferences and the specific asset being analysed. For shorter time frames – hours, for example – it's recommended to use between two to 10 periods; for longer time frames – weeks or months – 20 to 50 periods are recommended.
Step 3: Calculate the average
The final step is to calculate the average of these TR values. While Wilder originally used a simple moving average, many modern trading platforms now use an exponential moving average (EMA) for a more responsive indicator.
To calculate a 14-day ATR, you would first calculate the true range for each day as described above. The first ATR value is simply an average of the first 14 true ranges. After that, to achieve each subsequent average true range, you would multiply the previous 14-day ATR by 13, add the most recent day's true range, and then divide the result by 14.
Interpreting the Average True Range (ATR) indicator
Understanding how to interpret the ATR is crucial for effective use in your trading strategy. The indicator provides a single number representing the average range of price movement over a specified period.
Higher ATR values indicate increased volatility, suggesting that prices are moving more dramatically. Conversely, lower ATR values suggest decreased volatility and more stable price action. It's important to note that ATR values tend to be higher for more volatile assets and lower for less volatile ones.
Traders should pay attention to sudden increases in the ATR, as these can signal potential breakouts or trend reversals. Such changes in volatility often precede significant price movements, having them valuable for both entry and exit decisions.
For example, if an asset's ATR remains below 1 and moves within a narrow band (e.g., between 0.81 and 0.90), it suggests that the asset isn't experiencing high levels of volatility. This might be an attractive option for a trader who doesn't have a large appetite for risk.

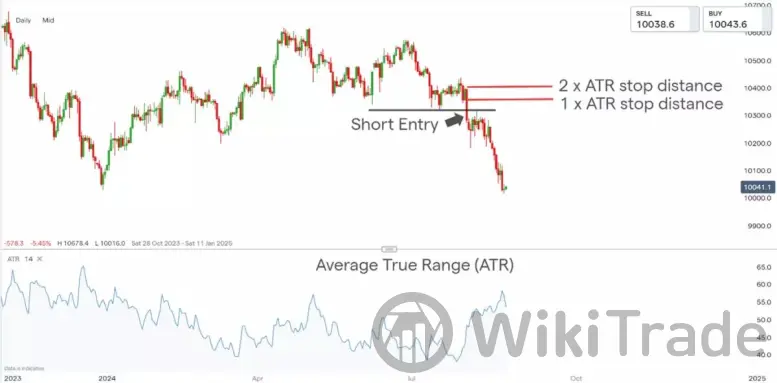
Using the Average True Range (ATR) for stop-loss orders
One of the primary applications of the ATR indicator is setting stop-loss orders that account for an asset's natural price fluctuations. This approach helps traders avoid being stopped out by normal market volatility while still protecting their positions.
To set a stop-loss using the ATR, traders typically use the following formulas:
For long positions: Stop Loss = Entry Price - (ATR * Multiplier)
For short positions: Stop Loss = Entry Price + (ATR * Multiplier)
The multiplier is a personal choice based on risk tolerance, with common values ranging from 1.5 to 3. For example, if you're long on a stock trading at £100 with a 14-day ATR of £2 and a multiplier of 2, your stop-loss would be set at £96 (£100 - £4).
This method adapts the stop-loss to the asset's volatility, offering wider stops during volatile periods and tighter stops during calmer markets. Traders can practise setting these stop-losses using a demo account before applying them to live trades.
In particularly volatile markets, you might want to implement a trailing stop at a certain number of points behind the current market price. The ATR indicator can help you do this by showing when volatility is rising or falling. You might want to reduce or increase the level at which you have placed a trailing stop to secure your profit while also protecting against potential heavy losses.
Alternatively, you might want to put a guaranteed stop on a position if you want to close out any possible losses at a specified and certain level. However, a guaranteed stop will incur a premium if it is triggered.
ATR-based position sizing for effective risk management
The Average True Range indicator is also valuable for determining position sizes, ensuring trades align with your risk tolerance. Here's a step-by-step method for using ATR in position sizing:
Determine the cash amount you're willing to risk per trade.
Calculate the per-unit risk using the ATR.
Divide your cash risk by the per-unit risk.
For shares trading, if your risk tolerance is £500, the stock price is £100, and the ATR is £2 with a 2 ATR stop-loss, your per-share risk is £4. Therefore, your position size would be 125 shares (£500 / £4).
For forex, indices, and commodities, the calculation is similar. If your risk tolerance is £500 and the per-contract risk (cash amount per point multiplied by the ATR value) is £10, your position size would be 50 contracts (£500 / £10).
Benefits and considerations of trading with the ATR indicator
The adaptability of the Average True Range makes it an excellent tool for risk management across various market conditions. Its ability to adjust to different volatility levels provides traders with a systematic and consistent approach to setting stop losses and determining position sizes.
By incorporating the ATR into their trading strategies, traders can:
Reduce emotional decision-having
Tailor risk management to fit any trading style or risk tolerance
Adapt to changing market conditions more effectively
Improve overall trading consistency
However, it's crucial to remember that the ATR is a lagging indicator based on historical data. As such, it should be used alongside other technical and fundamental analysis tools for a comprehensive trading strategy. Traders might consider combining ATR with other indicators like moving averages or relative strength index (RSI) for more robust analysis.
Other indicators that can help assess volatility levels include Bollinger bands and Keltner channels. Using these in conjunction with ATR can provide a more comprehensive view of market volatility and potential trading opportunities.
Applying the ATR indicator in different markets
While the ATR was originally developed for the commodities market, it has proven to be a versatile tool applicable across various financial markets:
Forex trading: In the volatile foreign exchange market, ATR can help traders set appropriate stop-loss levels and determine position sizes based on currency pair volatility.
Stock trading: For equity traders, ATR can be particularly useful in identifying potential breakout trades and managing risk in both trending and ranging markets.
Index trading: When trading stock indices like the FTSE 100 or S&P 500, ATR can help traders gauge overall market volatility and adjust their strategies accordingly.
Commodity trading: In its original application, ATR remains a valuable tool for commodity traders dealing with markets known for their price volatility.


Top News
 WikiTradeWikiTradeWikiTradeWikiTradeWikiTradeWikiTradeWikiTradeWikiTradeWikiTradeWikiTrade