


Leading vs. Lagging Indicators: Which Should You Trade With?
Abstract: Lagging indicators use past price data to provide entry and exit signals, while leading indicators provide traders with an indication of future price movements, while also using past price data. When faced with the dilemma of leading vs lagging indicators, which should traders choose? The answer to this question ultimately comes down to individual preference after understanding the advantages and limitations of each.
What's the difference between lagging and leading indicators?
Lagging indicators
Lagging indicators are tools used by traders to analyse the market using an average of previous price action data. Lagging indicators, as the name implies, lag the market. This entails that traders can witness a move before the indicator confirms it – meaning that the trader could lose out on several pips at the start of the move. Many consider this as a necessary cost to see if the move gathers momentum. Others view this as a lost opportunity as traders forgo getting into a trade at the very start of a move.
Common lagging indicators include:
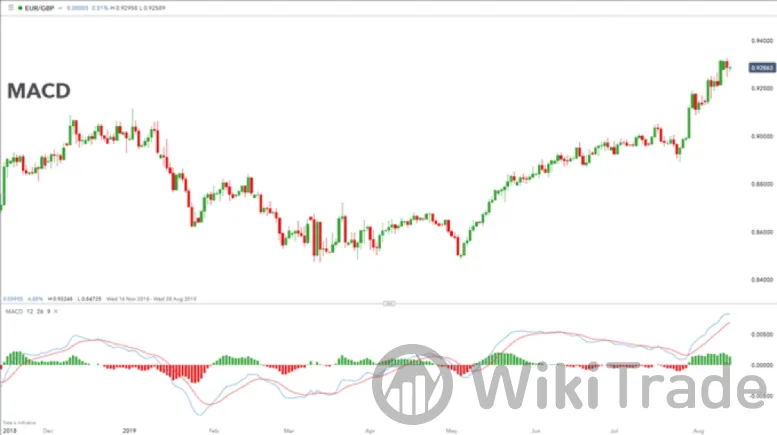
Moving Average Convergence Divergence (MACD)
Simple Moving Averages (SMA)
Stochastic Oscillator
Relative Strength Index (RSI)
Leading indicators
A leading indicator is a technical indicator that uses past price data to forecast future price movements in the market. Leading indicators allow traders to anticipate future price movements and therefore, traders can enter trades potentially at the start of the move. The downside to leading indicators is that traders are anticipating a move before it happens and the market could move in the opposite direction. As a result, it isnt uncommon to witness false breakouts, or, signs of a trend reversal that just land up being minor retracements.
Common leading indicators include:
Fibonacci retracements
Donchian channels
Support and resistance levels
Client Sentiment (IG Client Sentiment)
Leading vs lagging indicators: Advantages and limitations
The following table presents the advantages and limitations of each indicator to assist with the ‘leading vs lagging’ conundrum.
| Leading indicators | Lagging indicators | |
| Advantages | Provide favourable entry points for a possible move. | Provides greater conviction to enter trades – confirms recent price action |
| Leading indicators assist traders in their pursuit of entering higher probability trades because they identify key levels | Reduces the risk of failed moves or false breakouts | |
| Limitations | Forecasted price action is not guaranteed. Traders need to apply their own knowledge of these indicators in each situation | Traders sacrifice potential pips while waiting for confirmation from the lagging indicator |
| Leading indicators are often more insightful in advanced technical analysis techniques, such as Elliott Wave Theory, which may be daunting for new traders | Lagging indicators have no concept of key levels therefore, traders need to be aware of this |
Should you use leading or lagging indicators?
There are no perfect indicators. By their very nature, indicators will help traders discover likely outcomes as opposed to a sure thing. It is up to the trader to conduct a thorough analysis, to stack the odds in their favor.
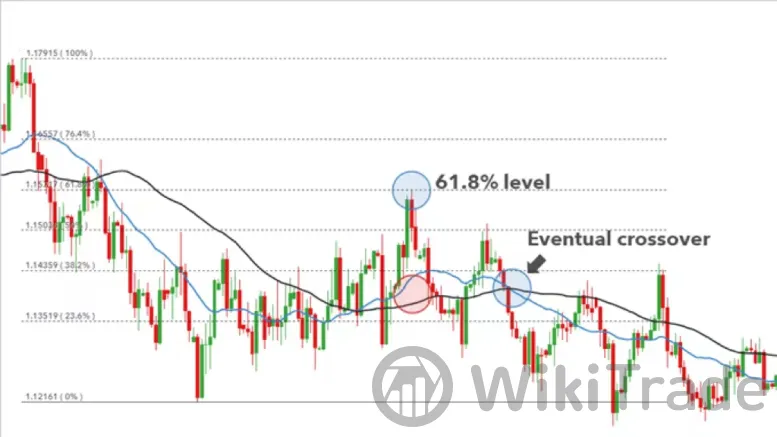
To further illustrate this point, below is an example of leading vs lagging indicators in EUR/USD, where the leading indicator appears to provide a better signal. Keep in mind that this is purely for demonstration and that the lagging indicator is equally important.
The market sold off aggressively before retracing to the significant 61.8% level. Using a simple moving average (21, 55, 200), it is clear to see that the faster blue line (21) has not crossed below the slower black (55) line and therefore, this lagging indicator has not yet provided a short signal.
However, upon further analysis traders would be able to see that the market failed to break and hold above the 200-day moving average. The 200 SMA is widely viewed as a great indicator of long-term trends and, in this example, is acting as resistance. This supports the short bias for traders eying a bounce lower off the 61.8% level.
Traders looking for fast signals will tend to favor leading indicators but can also reduce the time period setting on lagging indicators to make them more responsive. However, this should always be implemented with a tight stop loss if the market moves in the opposite direction.
Traders seeking a greater degree of confidence will tend to favor lagging indicators. These traders often trade over longer time frames looking to capitalize on continuing momentum after entering at a relatively delayed entry level, while implementing sound risk management.
What is a lagging indicator?
A lagging indicator is a tool used by traders to analyse the markets using an average of previous price action data. There are multiple lagging indicators, all of which are used to examine market trends, and entry and exit points.
Lagging indicators are presumed to be most effective during trending markets. However, many signals occur after the actual trade movement has occurred, leaving traders with fewer profitable pips.
What are some examples of lagging indicators?
The most frequently used lagging indicators are those about the moving average. Examples of these are the simple moving average (SMA), exponential moving average (EMA), and MACD – see below. All these indicators use past price movements alongside different formulae to create unique market signals. Further to this, these indicators can be edited to suit the trader by changing the defining parameters within each formula.
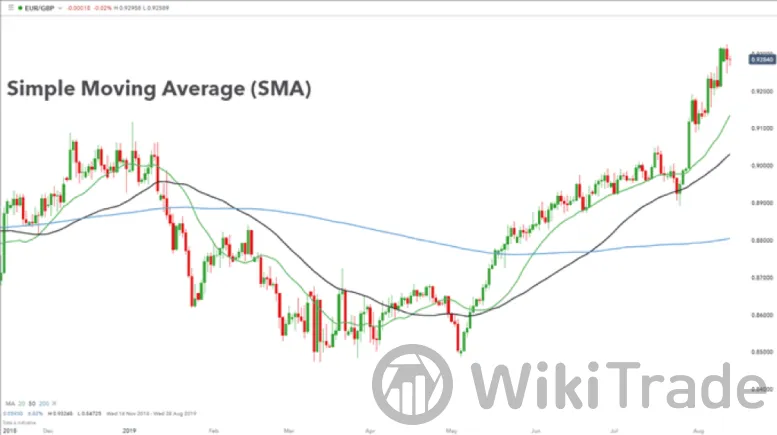
Simple Moving Average (SMA):
The SMA is a lagging indicator that characterizes the average closing price of a financial instrument over a particular time frame.
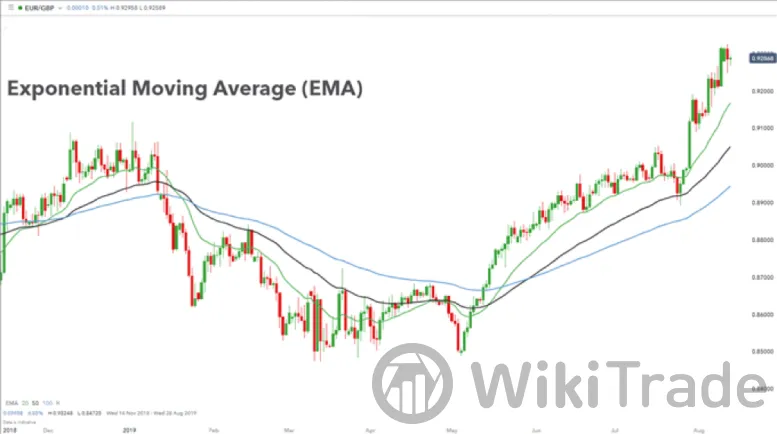
Exponential Moving Average (EMA):
The EMA is a lagging indicator that is a result of the SMA calculation; the only difference being that the EMA favors more recent price movements.
MACD:
The MACD is a lagging indicator that calculates the association between various EMAs.
Benefits of lagging indicators
There are several benefits of using lagging indicators that are often taken for granted by novice traders. Below is a list of these benefits which will assist traders in identifying when to implement them:
The lagging aspect of indicators will get traders into trades that have greater confirmation behind them as they are based on more data. In other words, the indicator will force traders to wait a bit before entering
Entry and exit points can be identified
Lagging indicators work extremely well in strong trending markets
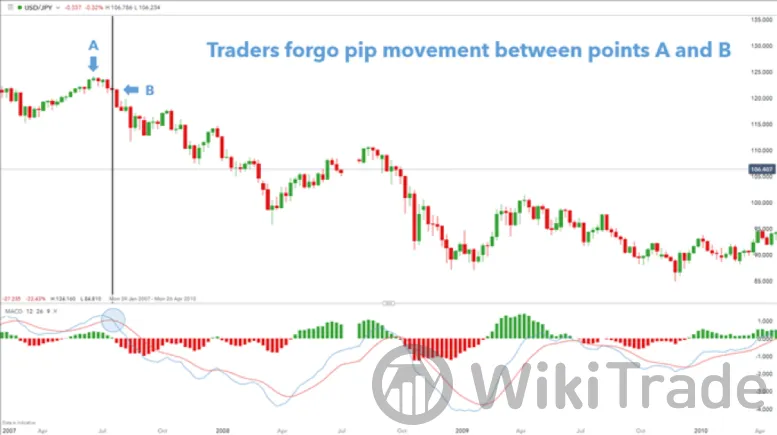
The weekly chart below depicts a trading strategy on USD/JPY using a MACD crossover strategy. Entry occurs when the MACD line crosses the signal line as highlighted. Initially, traders forgo the positive price movement between point A and point B on the chart due to the lagging nature of MACD. However, after entry the trade is set up to maximize the pip movement from point B through to the swing low. As can be seen in this example, traders can be successful even though there are some forgone gains prior to entry.
Lagging indicators are a great tool to utilize when trading the markets. They are extremely flexible in what they offer which can enhance a trading strategy or provide additional support to a trader‘s analysis. These indicators are a great tool to understand and potentially incorporate into every trader’s repertoire.
What is a Leading Indicator?
A leading indicator is a technical indicator that uses past price data to forecast future price movements in the forex market. While there is no single indicator that forecasts future prices with 100 percent accuracy, traders will be able to view how prices could unfold in the future and then apply further analysis to spot ideal entries on the market.
The opposite of a leading indicator is a lagging indicator and while they both make use of past data –the lagging indicators use past data to project future price levels. Lagging indicators use past price data to confirm a recent change in price.
What are some examples of leading indicators?
The main, generally accepted, leading indicators include:
Fibonacci Retracements
Donchian channel
key levels of support and resistance.
These will be presented and briefly discussed below.
Fibonacci Retracements
In short, the Fibonacci retracement consists of numbers or ratios that are mathematically significant numbers that occur throughout nature and often in financial markets. The most important number or ratio is 61.8% or .618 level. In Forex trading, Fibonacci retracements can identify future possible levels of support and resistance.
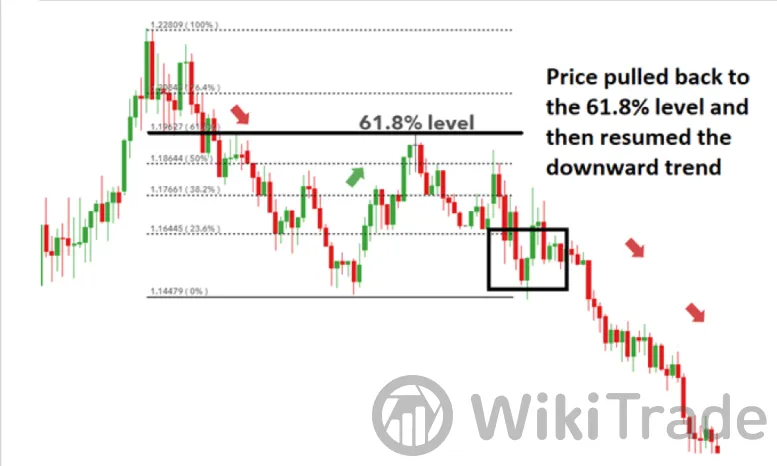
The EUR/USD chart below maps out the direction that future prices may approach if the 61.8% level is respected.
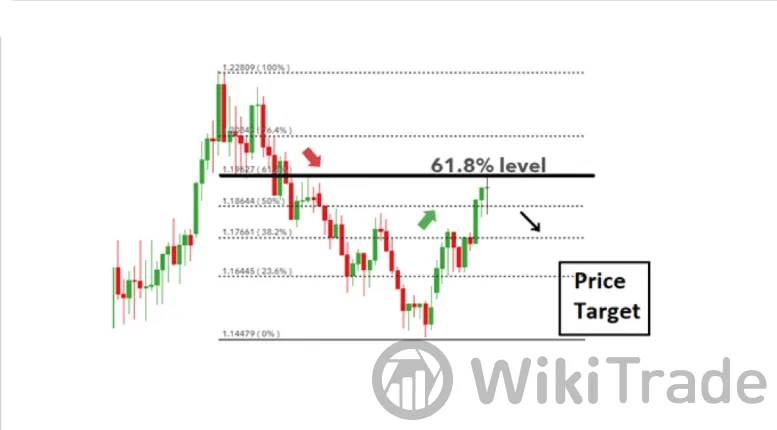
The 61.8% level was respected and the market resumed the broader downtrend and proceeded through the initial price target box to make a series of lower lows.
Donchian Channel
The Donchian channel calculates the highest high and the lowest low for the past X number of periods and presents this as an upper line and lower line. The upper and lower lines get updated as prices continue to move.
The Donchian channel indicator is great for breakout or reversal trades in strong trending markets. For example, the USD/JPY chart below shows how Donchian channels can help traders trade a breakout
Price starts out having lower lows and touches the lower bound of the channel before moving up.
Price breaches the upper channel after a touch of the lower channel, providing the first bullish signal. A break of the upper channel after a touch on the lower channel is seen as the first signal for a long trade.
The upper channel at point number 2 extends a horizontal line to the right, corresponding with the recent high. This acts as resistance and serves as further confirmation if the price breaks above this level – which it does. Even though there is a large retracement, the price does not breach the lower channel and eventually moves back up and past point 3.
A long signal is triggered when the price rises off the lower channel (1) to breach the upper channel for the first time (2).
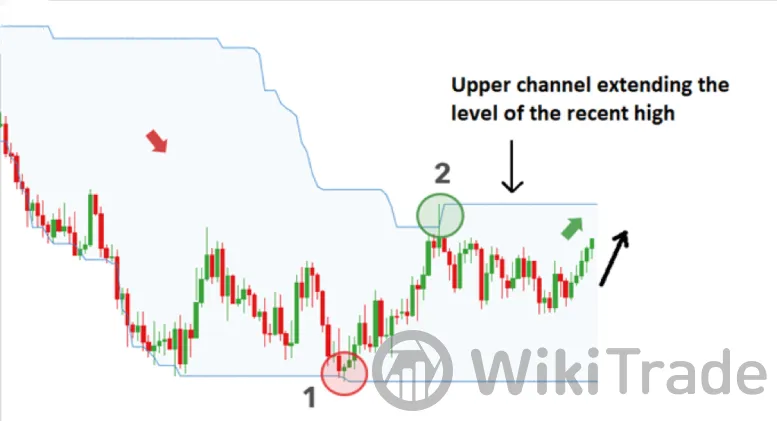
The upper channel line extends to the right and provides a level of resistance to be tested or respected. With a long bias, traders will be looking for prices to break this level, creating higher highs.
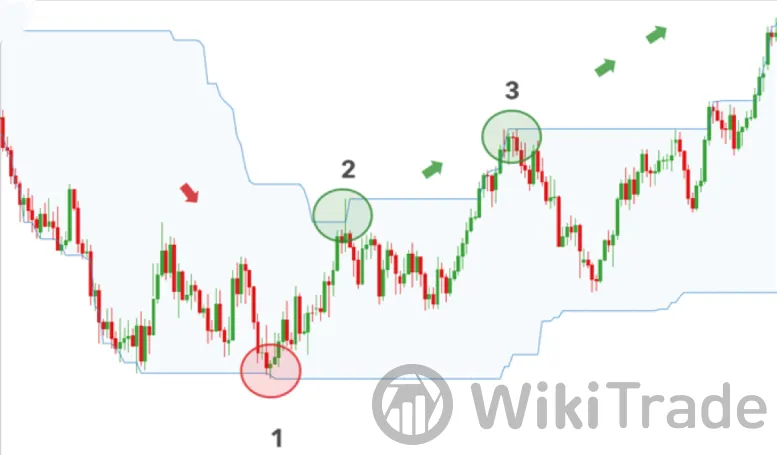
Even though there is a large retracement between points (2) and (3), the price does not breach the lower channel and eventually moves back up to create a new high at point (3).
In an upward move like the one seen above, traders can utilize the lower channel as a manual trailing stop and adjust it upwards as the market advances.
Key Levels of Support and Resistance
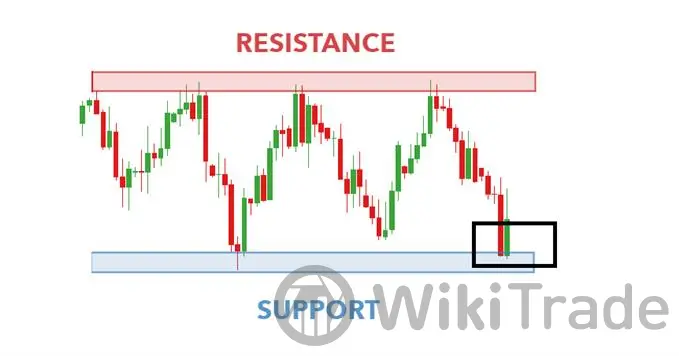
Key levels of support and resistance occur when the price approaches a particular level, multiple times, without breaking through it. This often results in price bouncing off two key levels in a range. Knowing where the price has been before can assist traders in assessing where the target should be placed.
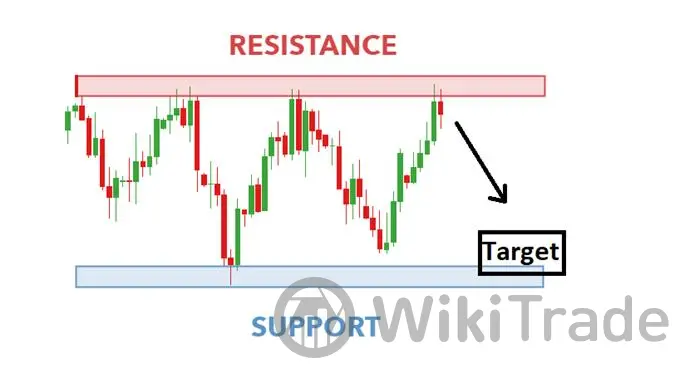
In this example, the price has approached resistance and turned, meaning the target should be placed at or just above support and a stop can be placed above resistance; while maintaining a positive risk-to-reward ratio. Price continued to move down and subsequently hit the target level.
Benefits of leading indicators
Leading indicators are by no means a crystal ball, but they do allow the trader to visualize the various ranges where future prices could trade. When having an idea of future price movements, traders are better placed to identify targets and stops with greater accuracy.
Leading indicators provide the following benefits:
Presents a clear directional bias
Provides traders with a target level
Provides traders with a stop-loss level
Leading indicators are not limited to just one indicator
Leading indicators can act as a filter (i.e. trades that do not line up with the indicator can be disregarded)
Leading Indicators: A Summary
Leading indicators provide traders with indications of future price movements and by extension, clear stops and limits. Due to the fact that there is uncertainty when trading the financial markets, traders cannot afford to adopt a laid-back approach to risk management simply because a leading indicator provides a direction and level for future price movements. Remember that prudent risk management should be adopted at all times.
Frequently Asked Questions (FAQs)
If leading indicators provide faster signals on proposed moves, then surely, are they superior to lagging indicators?
It is easy to fall into this trap as it is second nature for traders to want to capitalize on a large move as soon as they appear. Traders need to appreciate that while leading indicators identify possible areas of future price movement, they are not to be viewed as sure things. Further trend, sentiment, and momentum analysis will help confirm or invalidate the trade.
What combination of moving averages provides the best results?
Once more, this is about personal preference. The most popular moving averages include 20, 50, 100, and 200, which can be altered, using Fibonacci numbers to 21, 55, 100, and 200. The 21-period MA can be used in conjunction with the 55 MA for faster, more frequent signals while the 100 and 200 are used to assess market trends.


Top News
 WikiTradeWikiTradeWikiTradeWikiTradeWikiTradeWikiTradeWikiTradeWikiTradeWikiTradeWikiTrade